Tell better stories
with your data
Provide your audience with an interactive data visualization experience that allows for improved exploration of the data you want to share
Provide your audience with an interactive data visualization experience that allows for improved exploration of the data you want to share
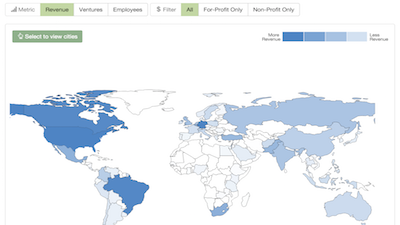
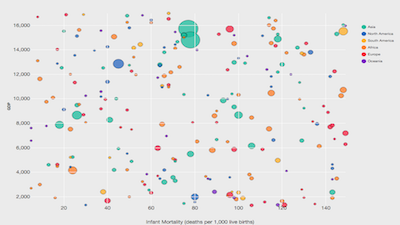
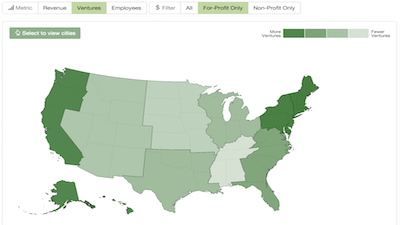
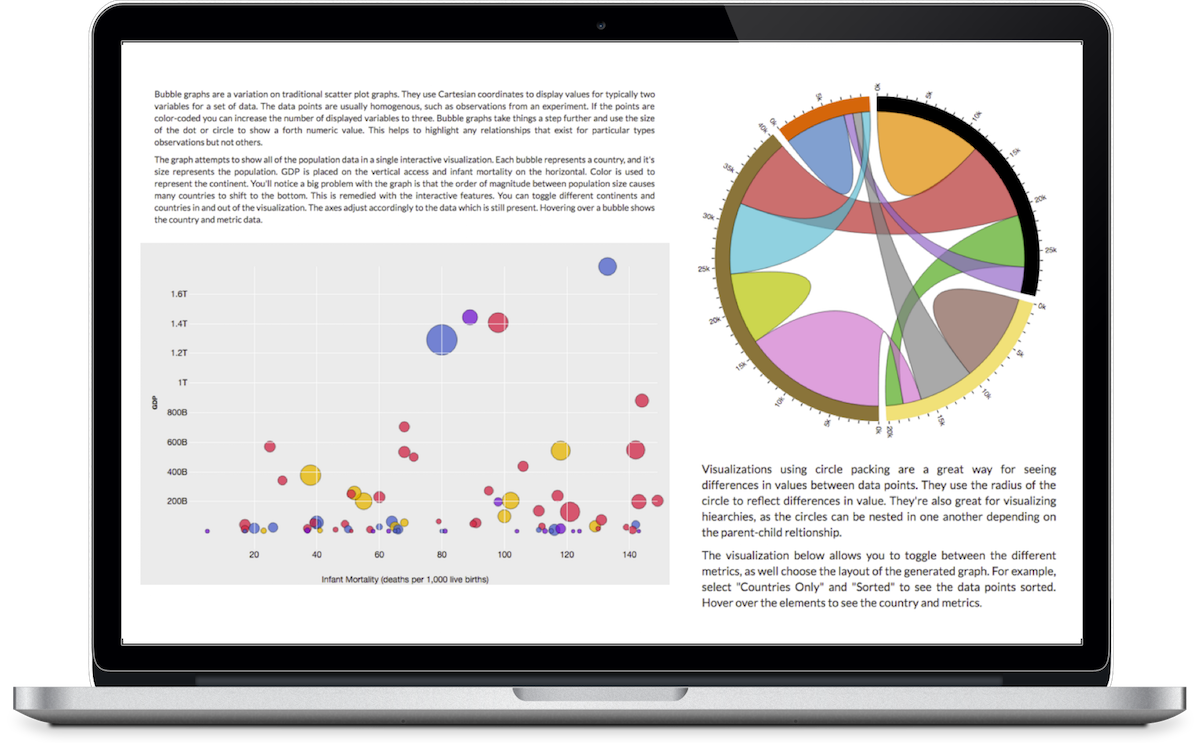
Consumers of your data need more than a picture. Advanced, interactive graphs allow for more information to be conveyed in the same space. Provide your audience with a way to explore more of the information you want to share.
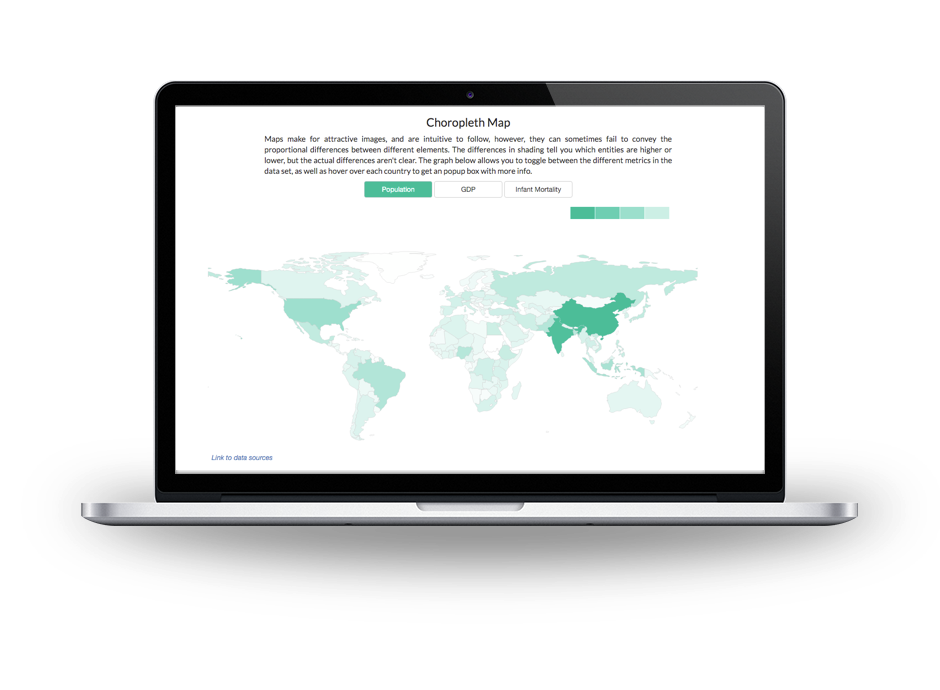
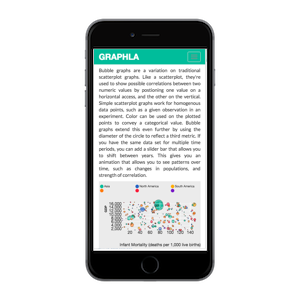
Visualizations that adapt to devices and don't require plugins. Good designs built entirely with HTML5, CSS, and JavaScript ensure graphs are still informative and interactive on any display, and can be integrated into your environment more easily.
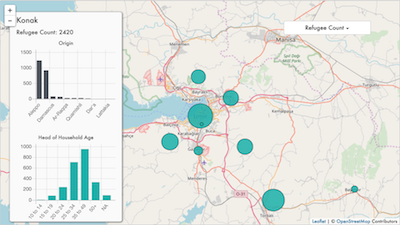
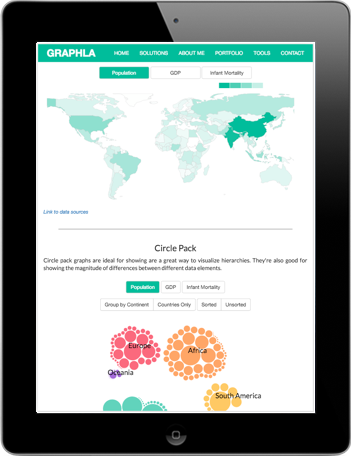
Showcase research by combining text with interactive visualizations to give your audience a more engaging experience.
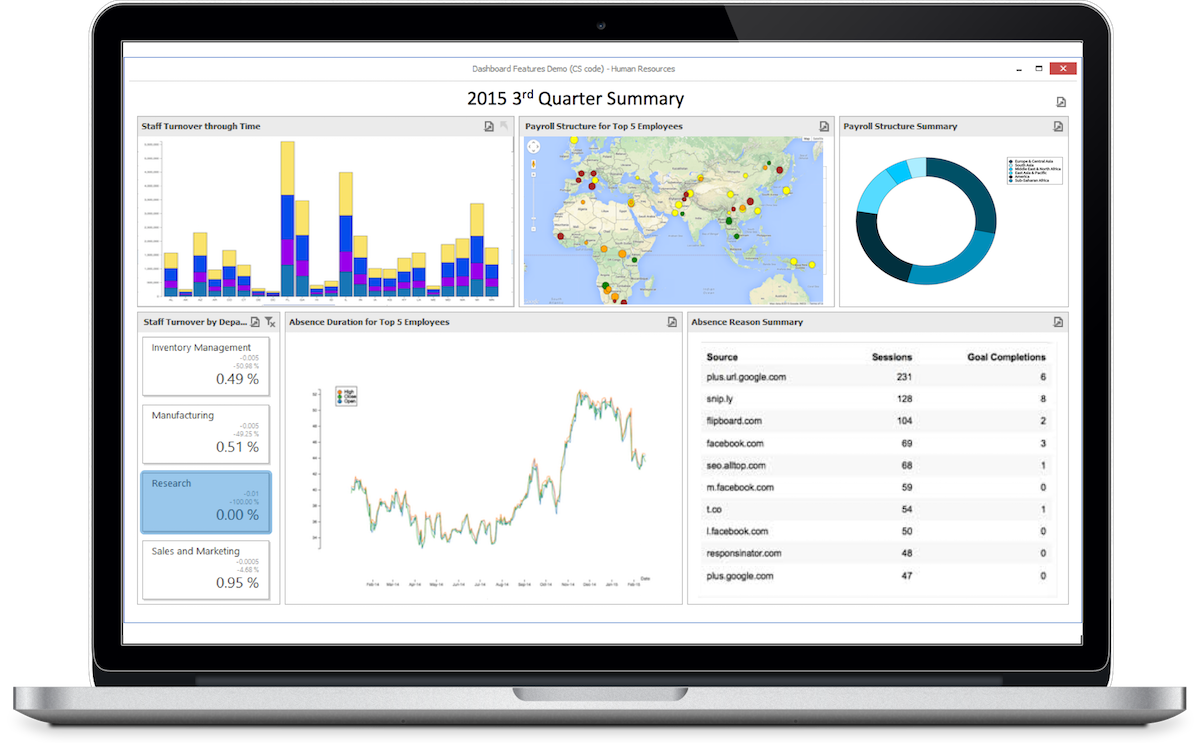
Add more value and mobile responsiveness to the data visualizations within your web applications.

Tom Wall is a full-stack web developer with over ten years of experience working in technology. In particular, his background covers the areas of data visualization, database programming, and business intelligence. He has a strong problem-solving background with the skills to transform abstract concepts into deliverable solutions. Tom has worked with companies ranging in size from Fortune 500 to small startups, across industries such as insurance, ecommerce, humanitarian relief, and software development. He is the creator of Graphla, a web application that facilitates the exploration and visualization of data though a user-friendly interface. In his free time, he enjoys reading and runs a literary fiction book club. Tom lives in Portland, Oregon.
Some services he offers:
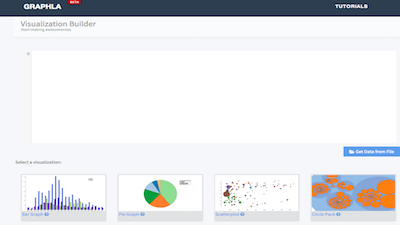
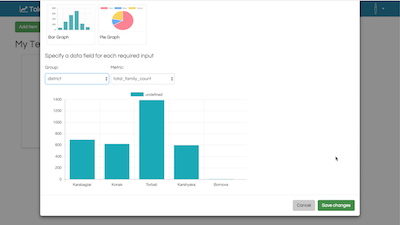
Free data visualization tool where you can explore data with an intuitive interface for creating graphs. It's a demo of the types of functionality I can integrate into your applications. The tool runs entirely in your browser, so any data you enter stays on your computer. No data is stored or even transmitted.
Graphla is built using Angular.js and D3.js
Launch Graphla Watch Demo